













Market cap tier
Market capitalization (Cr)
Quarterly OPM %
Broad market indices
Sectoral indices
| Symbol | Company | Tier | Market Cap (Cr) | P/E | ROE (%) | ROCE (%) | OPM (%) | Listed |
|---|
No stocks match this combination of filters.
Understand the marketbefore you invest yourmoney.

Your early edge in the market. Global cues, key indicators and stocks in focus — delivered before the opening bell so you're never reacting, always ready.

Stocks to Watch
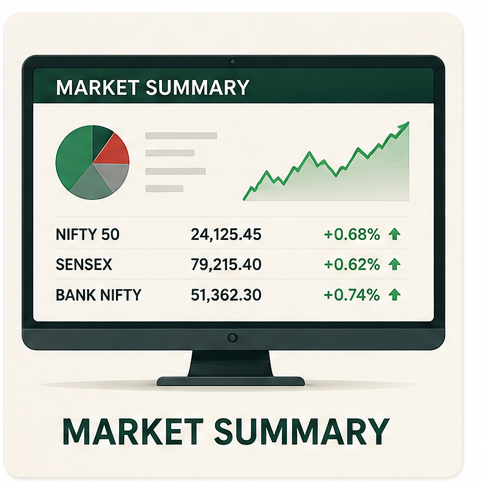
Market Summary
Current IPO
Indian Market Snapshot
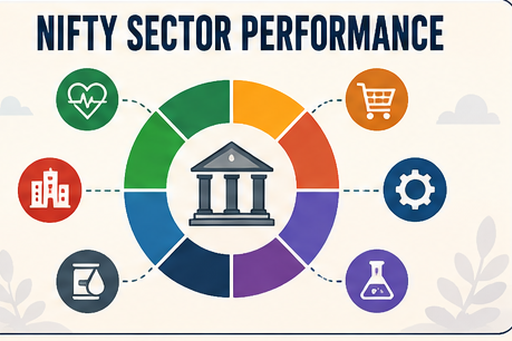
Sectoral Overview
Global Market SentimentTo Get Latest Report
CLICK HEREYour weekly compass for smarter decisions. Market summary, top movers, sector insights and the week's economic calendar, all in one read.

Weekly Market Snapshot
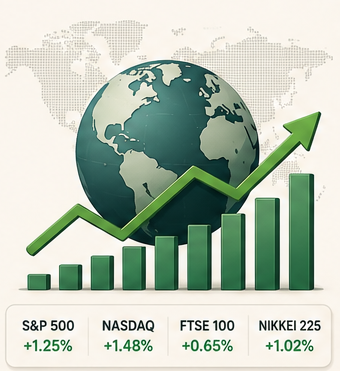
Global Performance
Commodities
Top News of the Week
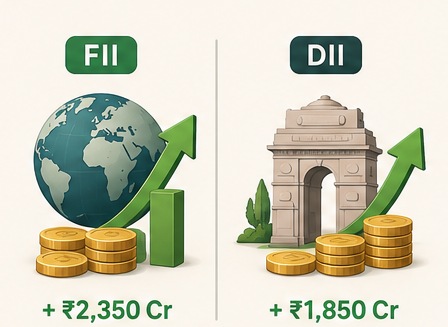
FIIs & DIIs Activity
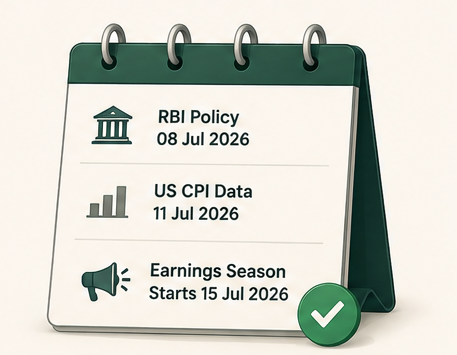
Upcoming Events
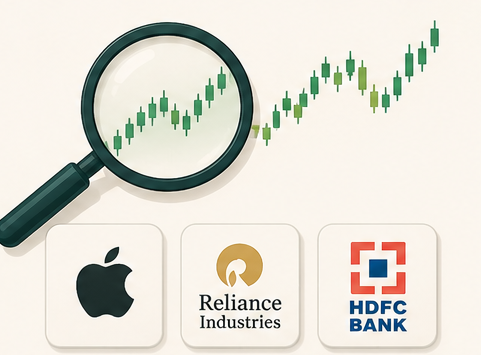
Stocks in FocusTo Get Latest Report
CLICK HERECurated insights and recommendations, designed for your financial growth.


Select a sector below, then click through to open its full performance report PDF.
Bubble size reflects the size of the YTD return, color shows direction. Click a sector bubble to open its full report.
Click on any index box below to open its official performance report PDF.
Everything you need to know about theme-based sectors, market heatmaps, and screener metrics.
The page covers theme-based indices including Nifty India Defence, Nifty IPO, Nifty Sugar & Ethanol, Nifty Commodities, Nifty EV & New Age Automotive, Nifty India New Age Consumption, Nifty100 ESG, Nifty500 Ahimsa, Nifty India Tourism, Nifty50 Shariah, and Nifty India Digital.
You can filter all listed NSE equities across market-cap tiers (Large, Mid, Small, Micro), quarterly operating profit margins (OPM %), broad and sectoral indices, and financial valuation ranges like P/E, ROE (%), and ROCE (%).
The heatmap visualizes sector momentum at a glance. The bubble size corresponds to the magnitude of the Year-to-Date (YTD) return, while the color indicates direction (green for positive gains, yellow/orange for moderate drops, and red for steep corrections).
All market indices, thematic performances, and screener metrics (including P/E, ROCE, and market cap) are synced daily with official NSE end-of-day market closing data.
The NSE Equity Screener allows users to search and filter NSE-listed equities using criteria such as market-cap tier, market capitalization, quarterly OPM, broad and sectoral indices, P/E ratio, ROE, and ROCE. Users can then view detailed stock information directly from the results table.